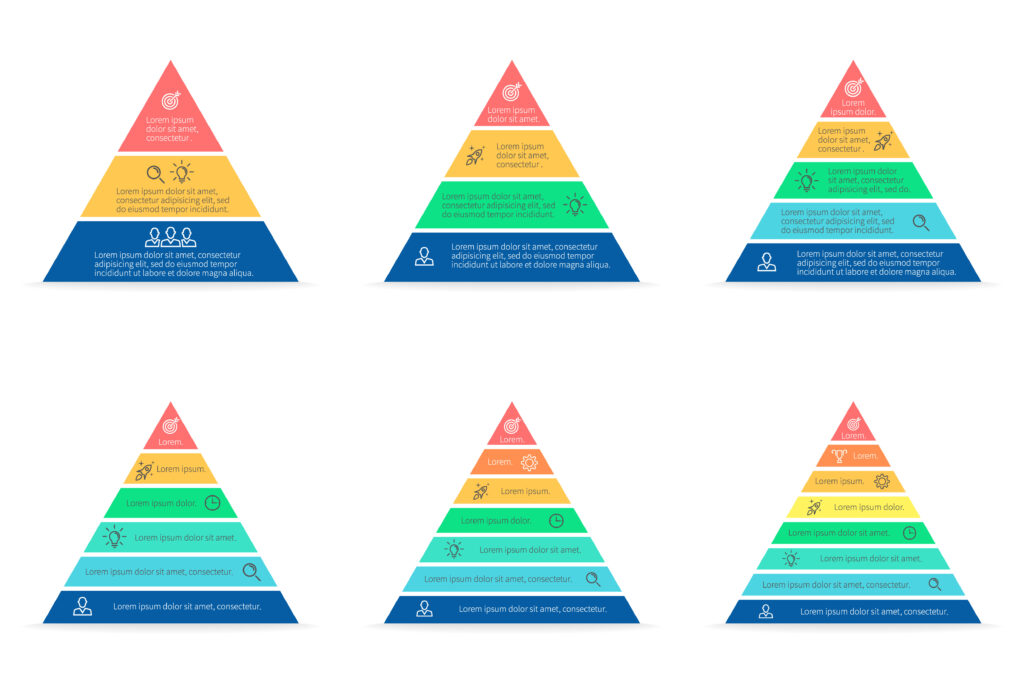
Examining the Effectiveness of Pyramid Charts for Decision-Making

Great business decisions are born of great data visualizations. That’s why it’s critical to understand and appreciate the power of data representation tools like pyramid charts. This article examines pyramid charts in detail, exploring their structure, utility, and effectiveness, especially in decision-making processes. Keep reading to understand why a pyramid chart is such a vital resource in the digital era.
Understanding Pyramid Charts

A pyramid chart is a graphical representation of data where the height, width, or area is employed to represent different data points. Just like the pyramids of Giza, these charts showcase a broader base escalating to a narrow apex, signifying a flow of data from a greater to a lesser value or vice versa.
The foundation of a pyramid chart lies in its unique organizational structure, which is not confined to one format. Pyramid charts can be constructed in horizontal, vertical, and even inverted formats to better present the integrity of the data. The adaptability of the pyramid structure allows the visualization of various types of hierarchical information, where each level signposts a specific fraction of the total data.
Despite the relative simplicity of its design, a pyramid chart is profound in its inferences. The incremental or decremental classification imparts a visual impact, rendering it effective in comparing different items. Additionally, its distinction to represent data in terms of proportions and quantities provides a dual advantage. The data can be easily partitioned and comprehended in parts, which makes the pyramid chart a handy tool for interpreting complex big data.
The Role of Pyramid Charts in Decision-Making
Pyramid charts play a significant role in decision-making processes because of their capacity to make complex data easy to comprehend. The clear visualization facilitates the extraction of insight from data- a crucial step in data-driven decision-making.
With the clear levels that pyramid charts present, decision-makers can easily identify the most important variables, parameters, or actors in the information. Hierarchical structures help elucidate exactly what’s happening from the top down or the bottom up, a significant advantage when prioritizing strategies or interventions.
Understanding each component’s structure and how they interact is typically tricky when you use textual data or listings. Pyramid charts simplify this process, allowing the decision-maker to clearly appreciate the cause-and-effect relationships.
However, as with all decision-making tools, pyramid charts are no magic solution to complex decisions. A proper understanding of both the tool and the data being fed into it is crucial to ensure the correct interpretation of the results.
Examples of Effective Pyramid Chart Implementation

The adage that a picture is worth a thousand words rings true in pyramid chart application. Whether in the business, education, or government setting, these charts have been instrumental in conveying complex data structures and relationships in an intelligible manner.
For instance, a company might use a pyramid chart to represent its strategy’s allocation of resources, showing the different functional departments’ proportions and their hierarchical relations. Not only does this make the strategy easy to understand, but it also increases transparency and accountability in resource usage.
On the other hand, a teacher might use an inverted pyramid chart to explain the writing process to students, with each level of the pyramid representing a different stage of the writing process. This visualization helps students prioritize and allot their time and effort effectively.
Lastly, government organizations often use pyramid charts in demographics, showing the age and sex distribution in a given population. This aids in public policy planning and decision-making processes. Altogether, the power of pyramid charts in decision-making is undeniable. Their ability to turn complex data into digestible, meaningful, visually appealing pieces of information makes them formidable tools in the modern business setting.
