How to Use the Heat Mapping Tool
A heat map helps businesses visualize and understand trends within location data that might otherwise remain hidden in spreadsheets. These maps can visualize marker density within a map or locate numerical data tied to geographic locations. Most mapping software offers customization options, from opacity, radius, or intensity threshold.
Understanding What a Heat Map Does
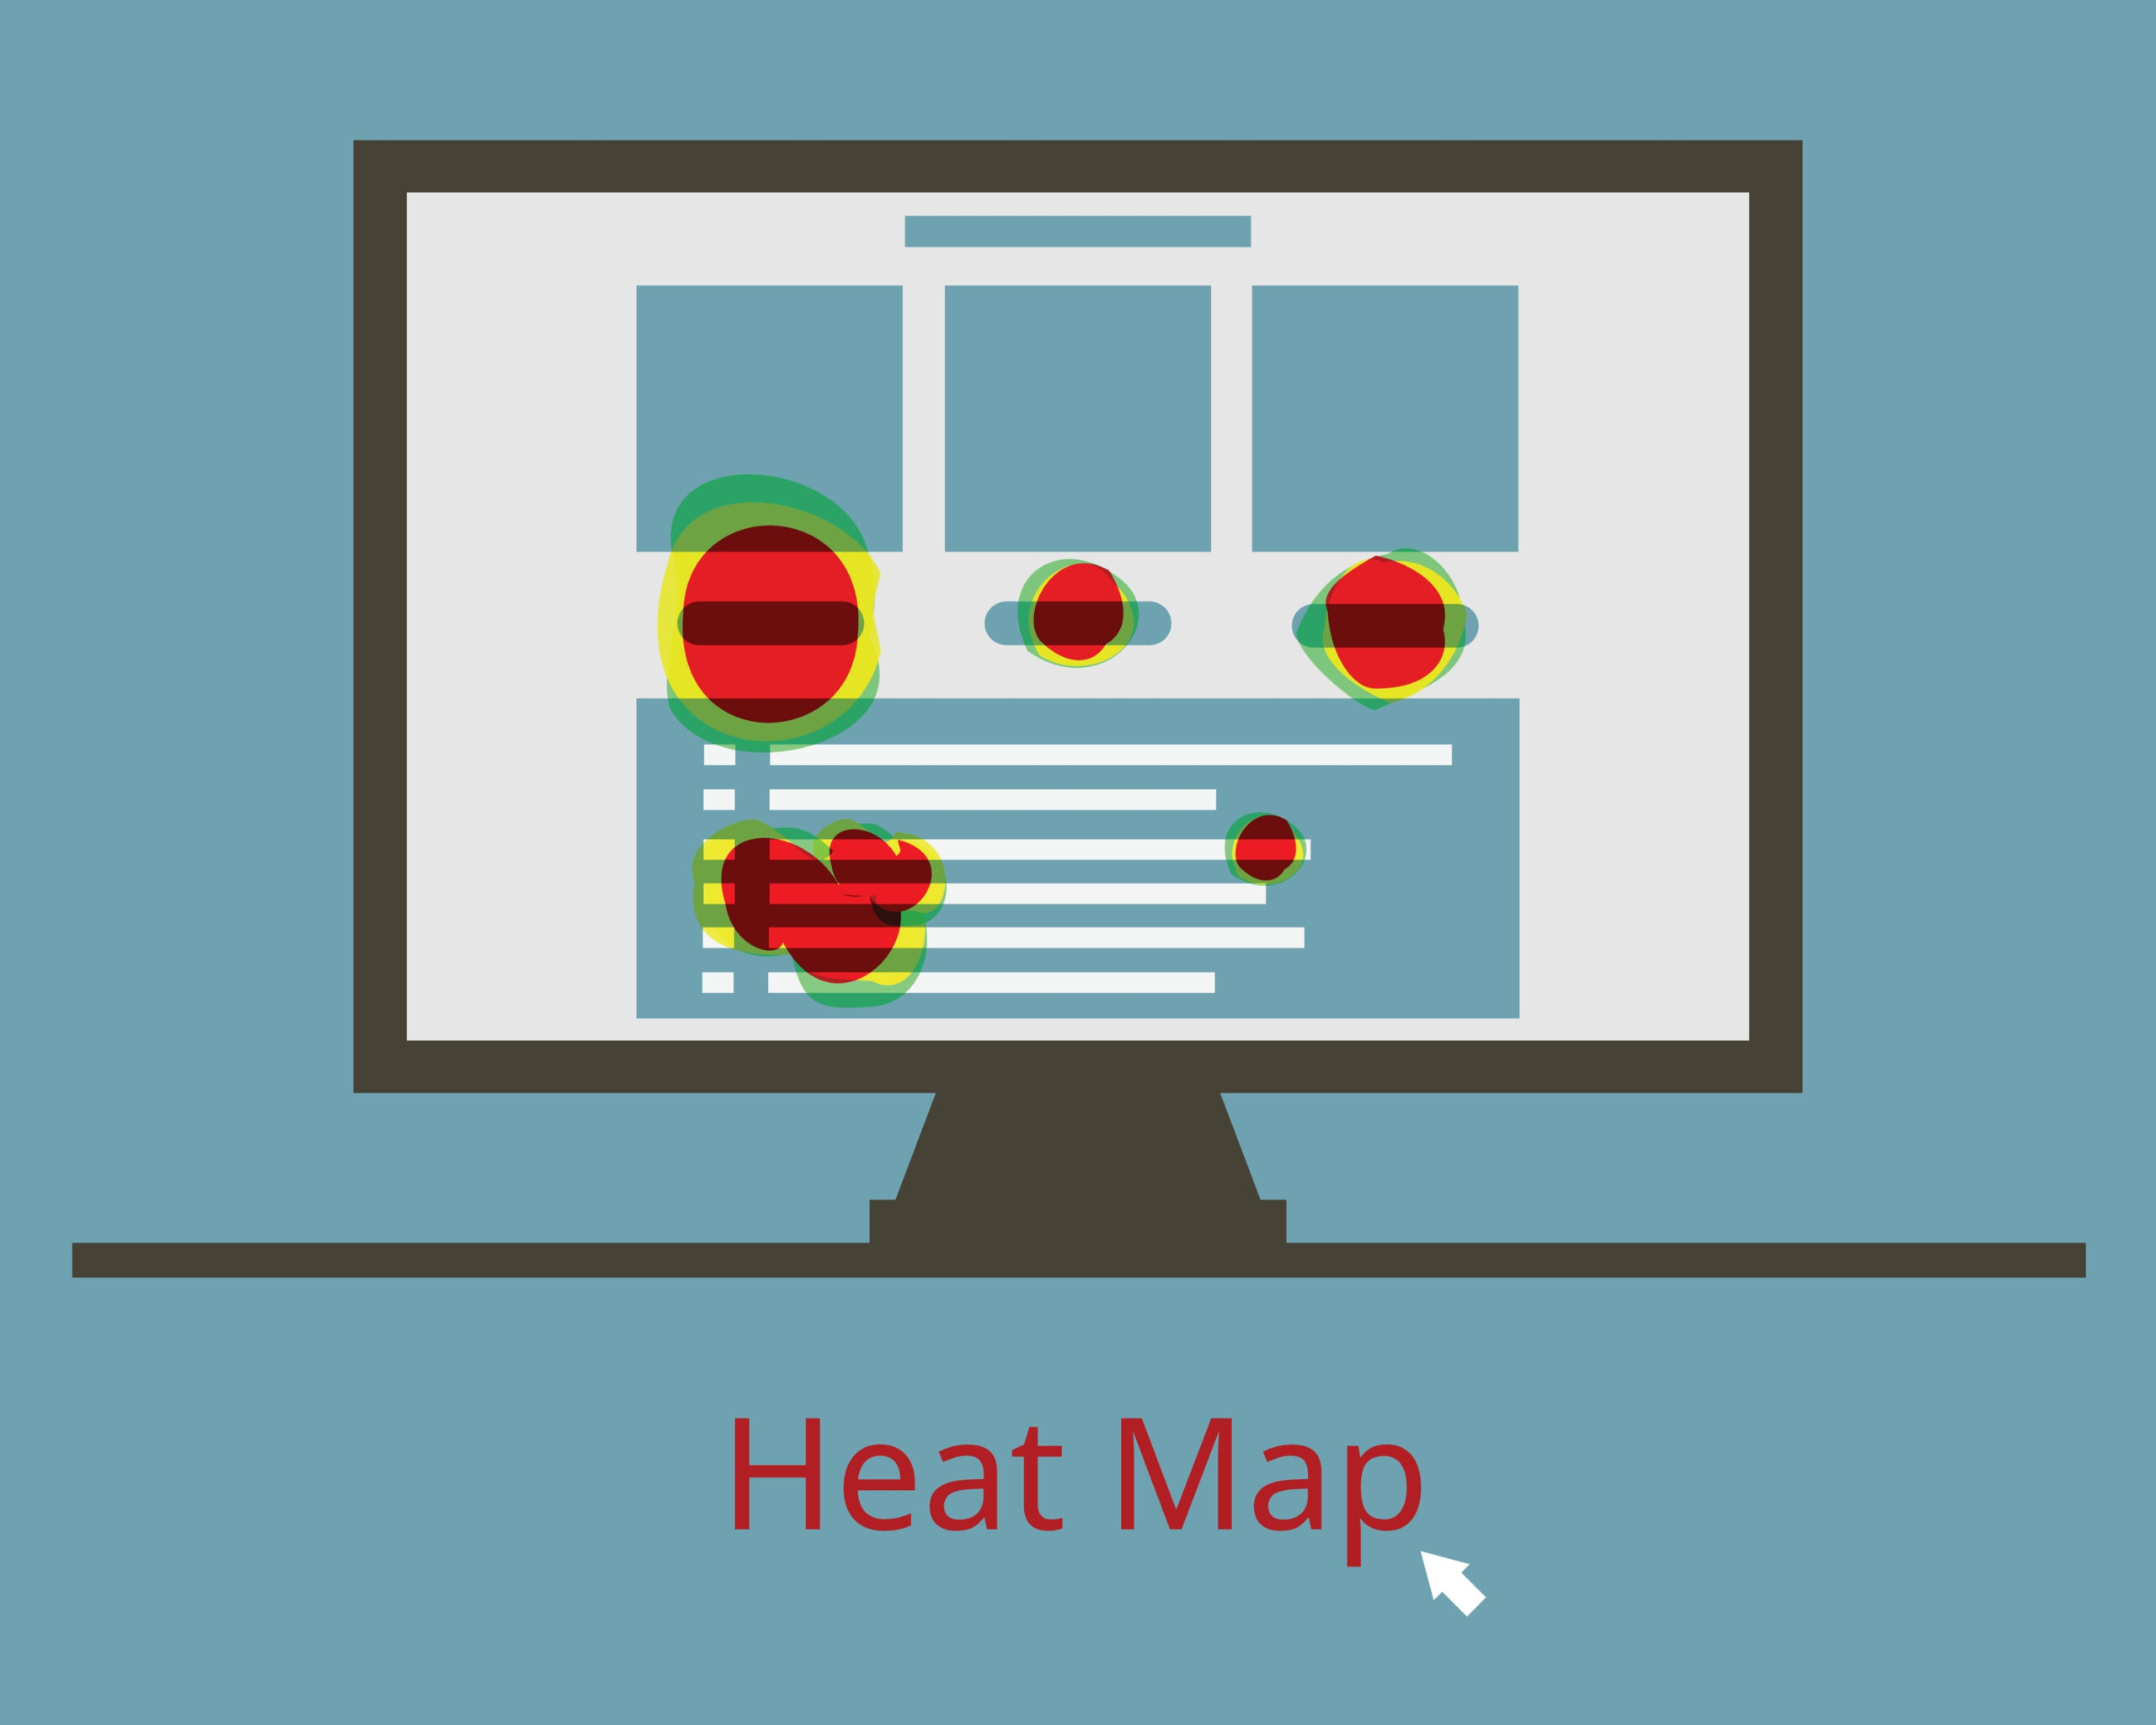
A heat ap will represent differing densities of data within a specific area on a map. These data points are color-coded circles, with all information aggregated based on the radius of influence and the particular location. As the density of your data increases, the heat map will display the corresponding color for higher intensity. These thresholds will hold a definable maximum for the highest color, representing the gradient (or the darkest shade if using a single color.) These variables can be adjusted by the user, depending on their preference.
What is a Heat Map Typically Used For in Business?
Heat maps will help business owners identify unique trends in data that would otherwise be difficult to see. For instance, you can quickly determine saturated areas within a sales boundary while other locations may hold a considerable market opportunity. The saturation within the map is directly connected with all imported company data.
Better Understand Market Availability
A heat mapping tool can help business owners develop a perfect sense of which customers access your stores or products by importing any spreadsheets connected with the business. The predetermined gradient will highlight areas of the map close to your physical locations, along with specific details highlighting distances too far for customers to travel. For online commerce, locate geographic areas capitalizing on promotions or delivery services using the geographic boundary function.
Understand Sales Density
Combining any metric within your spreadsheet with a geographic heat map can help business owners weigh specific location decisions. A heat map can incorporate physical locations like zip codes to determine demographic details within top-performing sales regions. Using sales data, your sales team can highlight your region’s highest sales density areas.
How to Use the Heat Mapping Tool
Using a heat map tool to visualize and identify unique trends in your location data isn’t difficult. To start, open your mapping software and locate the map tools function within the dashboard. Find the Heat Map Tool from the different options and select the heat map style you’d like to create. Heat maps can either represent marker density or numerical data. Confirm your selection and then customize your heat map with the various options available.
Using Google Heat Map Partners
With Google Maps’ capabilities, many mapping programs will integrate various map-based functions that are fully customizable. To create your heat map, follow these key steps:
Generate Your Heat Map from an Excel Spreadsheet
Taking raw data from your business and transforming it into a heat map isn’t challenging. Most mapping programs will allow importing functionality, connecting your files with the cloud-based program. You’ll be able to upload all consumer data and turn them into a heat map within minutes.
Analyze All Data by Marker Density
Raw data instantly transforms into visual maps within a few clicks of a button. The default viewing gives each marker on the map equal priority, so density is immediately apparent. Users can manually adjust the density thresholds depending on their personal preference. Likewise, use the heat map software to determine where high numbers of salespeople dominate and whether geographic areas need more resources.
Plot Numerical Data Using a Location Heat Map
Heat maps will allow users to organize location-based data into an easy-to-interpret picture. Select the data you’d like to see on the map and how much of the information you’d like to include with your visualization.
Customize All Heat Map Locations
Most mapping software will enable users to customize the results to match their visual and functional needs. This includes virtually every visible component of the Google heat map – from intensity threshold, color scales, opacity, and radius.
Try Plotting Your Google Heat Map Online
If you’re using cloud-based mapping software, you’ll be able to keep all data safe and secure online. Cloud-based mapping eliminates the need to store large data pieces while making the information fully transportable. Users can access all heat maps from any device, from home networks to mobile devices. Further, users can embed professional maps directly to the site or collaborate with all team members remotely.

